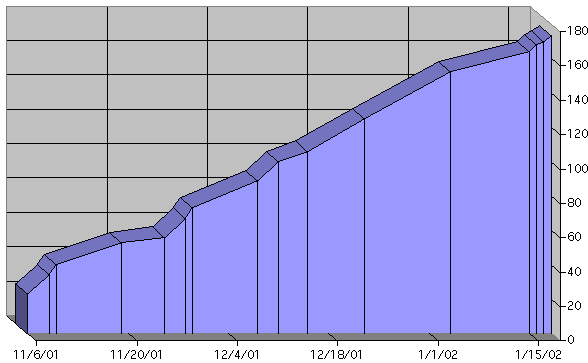
This chart shows a18-a33. Sigh, the slope is not as great as a1-a18, cuz I can't work on it now as much as I did then. Note the spike at the end! Hooray for Christmas vacation!

This chart shows a18-a33. Sigh, the slope is not as great as a1-a18, cuz I can't work on it now as much as I did then. Note the spike at the end! Hooray for Christmas vacation!

